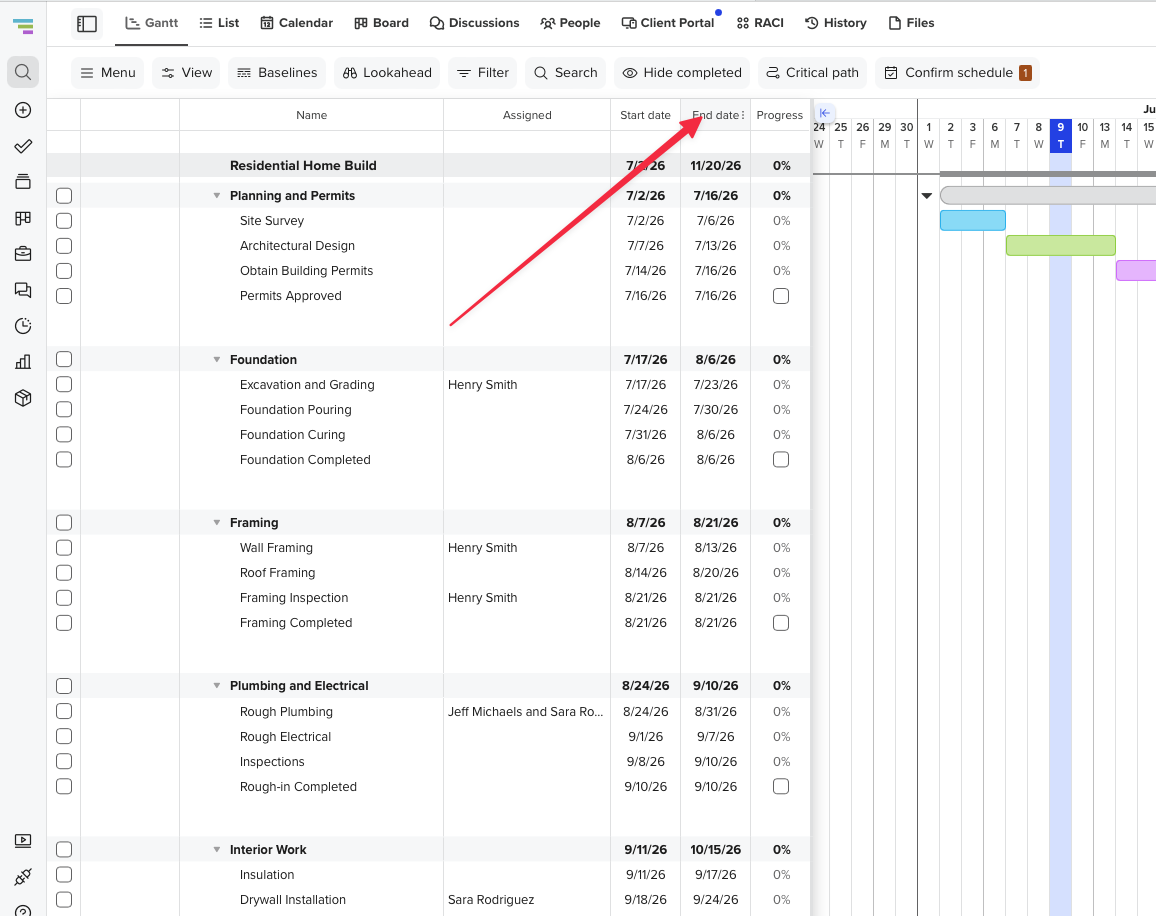
Which columns can I display in TeamGantt?
TeamGantt supports displaying the following columns in Gantt view:
- Baselines
- Baselines - Allows you to see how many days ahead or behind your task is now scheduled.
- Planned Start Date - Allows you to see when your task was originally scheduled to start.
- Planned End Date - Allows you to see when your task was originally scheduled to end.
- Dependencies
- Predecessors - Allows you to see the number of predecessors that the task has.
- Successors - Allows you to see the number of successors that the task has.
- Dates & Time
- Due in - Allows you to see how many days til your task is due.
- Duration - Allows you to see and enter the task duration in days.
- Estimated Hours - Allows you to see or enter the estimated hours assigned to a task
- Actual Hours - Allows you to see the sum of tracked time for a task.
- Start Date - Allows you to see the start date of the project, groups, and tasks.
- End Date - Allows you to see the end date of the project, groups, and tasks.
- Financials
- Budgeted cost - Allows you to see and enter the budgeted costs assigned to the task.
- Actual cost - Allows you to see and enter the actual costs assigned to the task.
- CBS - Allows you to enter the Cost Breakdown Structure for the task
- Task tracking
- Assigned - Allows you to see who is assigned to a task.
- Confirmation - Allows you to see if the assignee has confirmed their task assignment.
- Points - Allows you to see and enter points for tasks.
- Progress - Allows you to see the % complete of the tasks.
- Tools
- Selection - Allows you to select multiple tasks and groups
- Shortcuts - Allows you to see the comments, tracked time, and checklists on your tasks.
- Color - Allows you to see or change the task color assigned to the task.
- WBS - Allows you to see the Work Breakdown Structure of your project.
- Custom fields
- If your plan supports the Custom fields feature, you will have the option to enable custom fields columns.
Just to note, Columns that can be accessed will be determined by the features available on your plan. 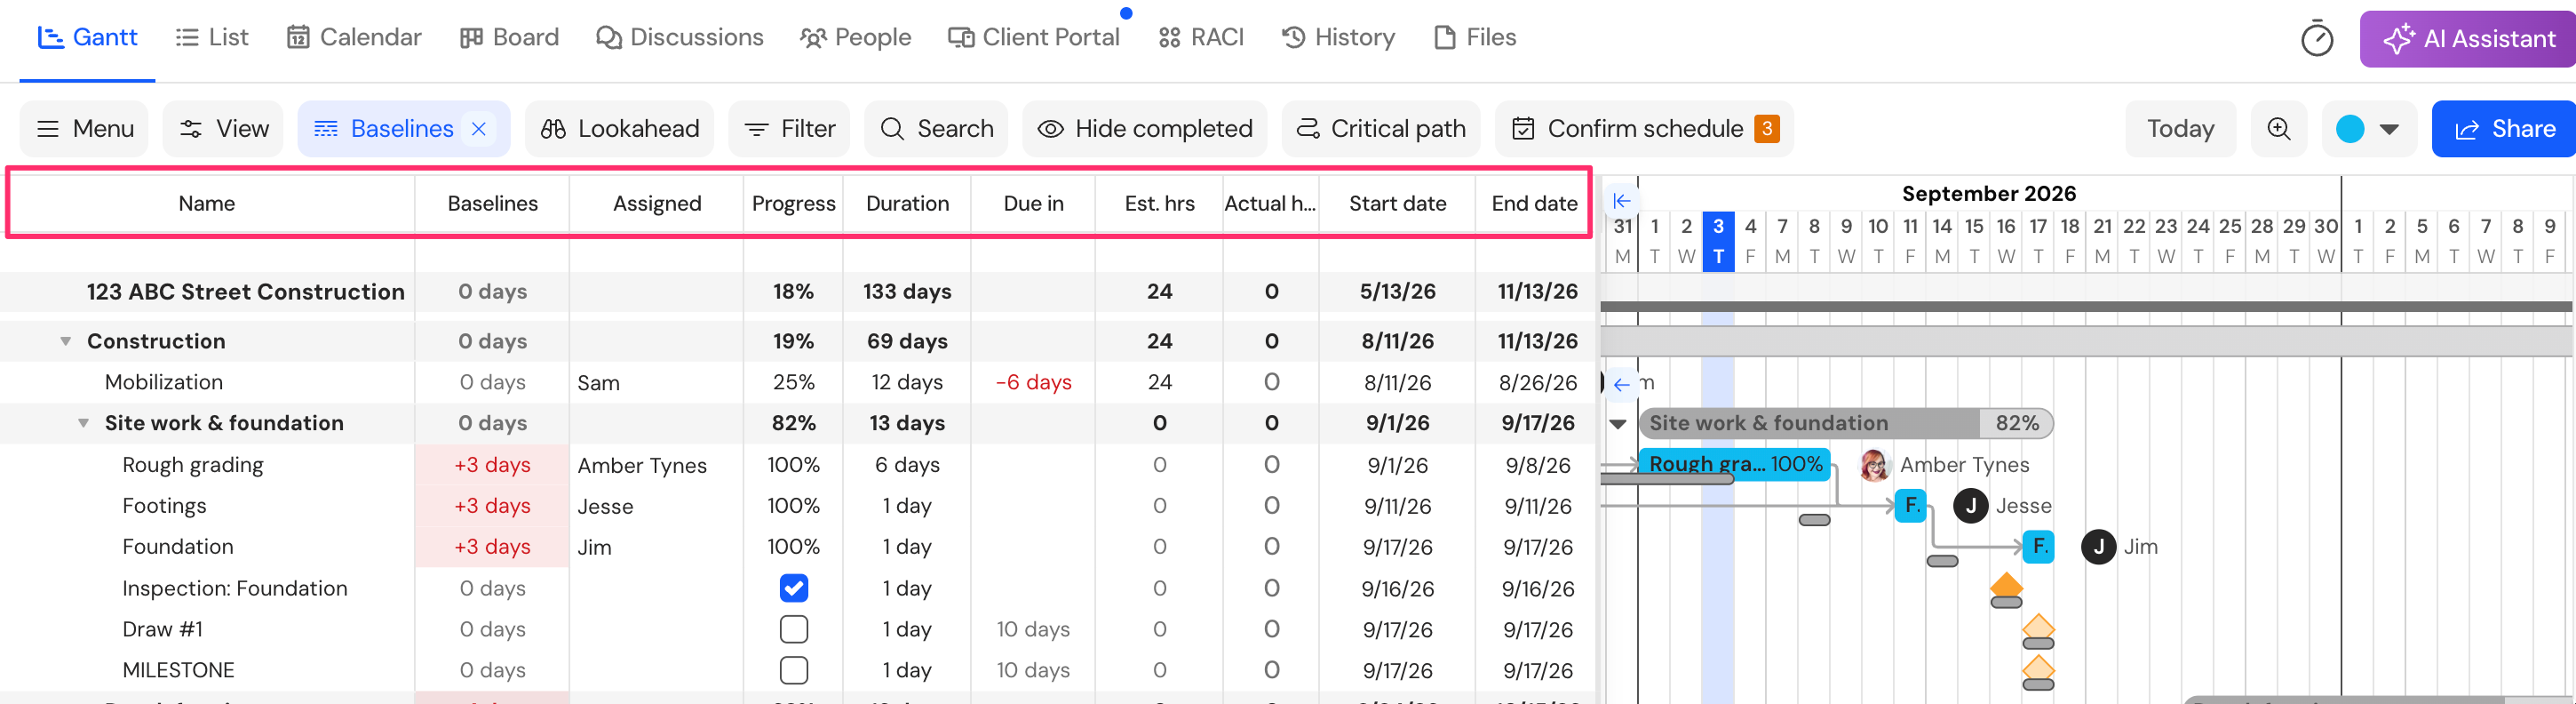
How do I show or hide columns in my Gantt chart?
You can choose which columns to display by going to the
View menu at the top of the Gantt chart and selecting the Columns pop-out menu. Then, simply select which columns you would like to display. 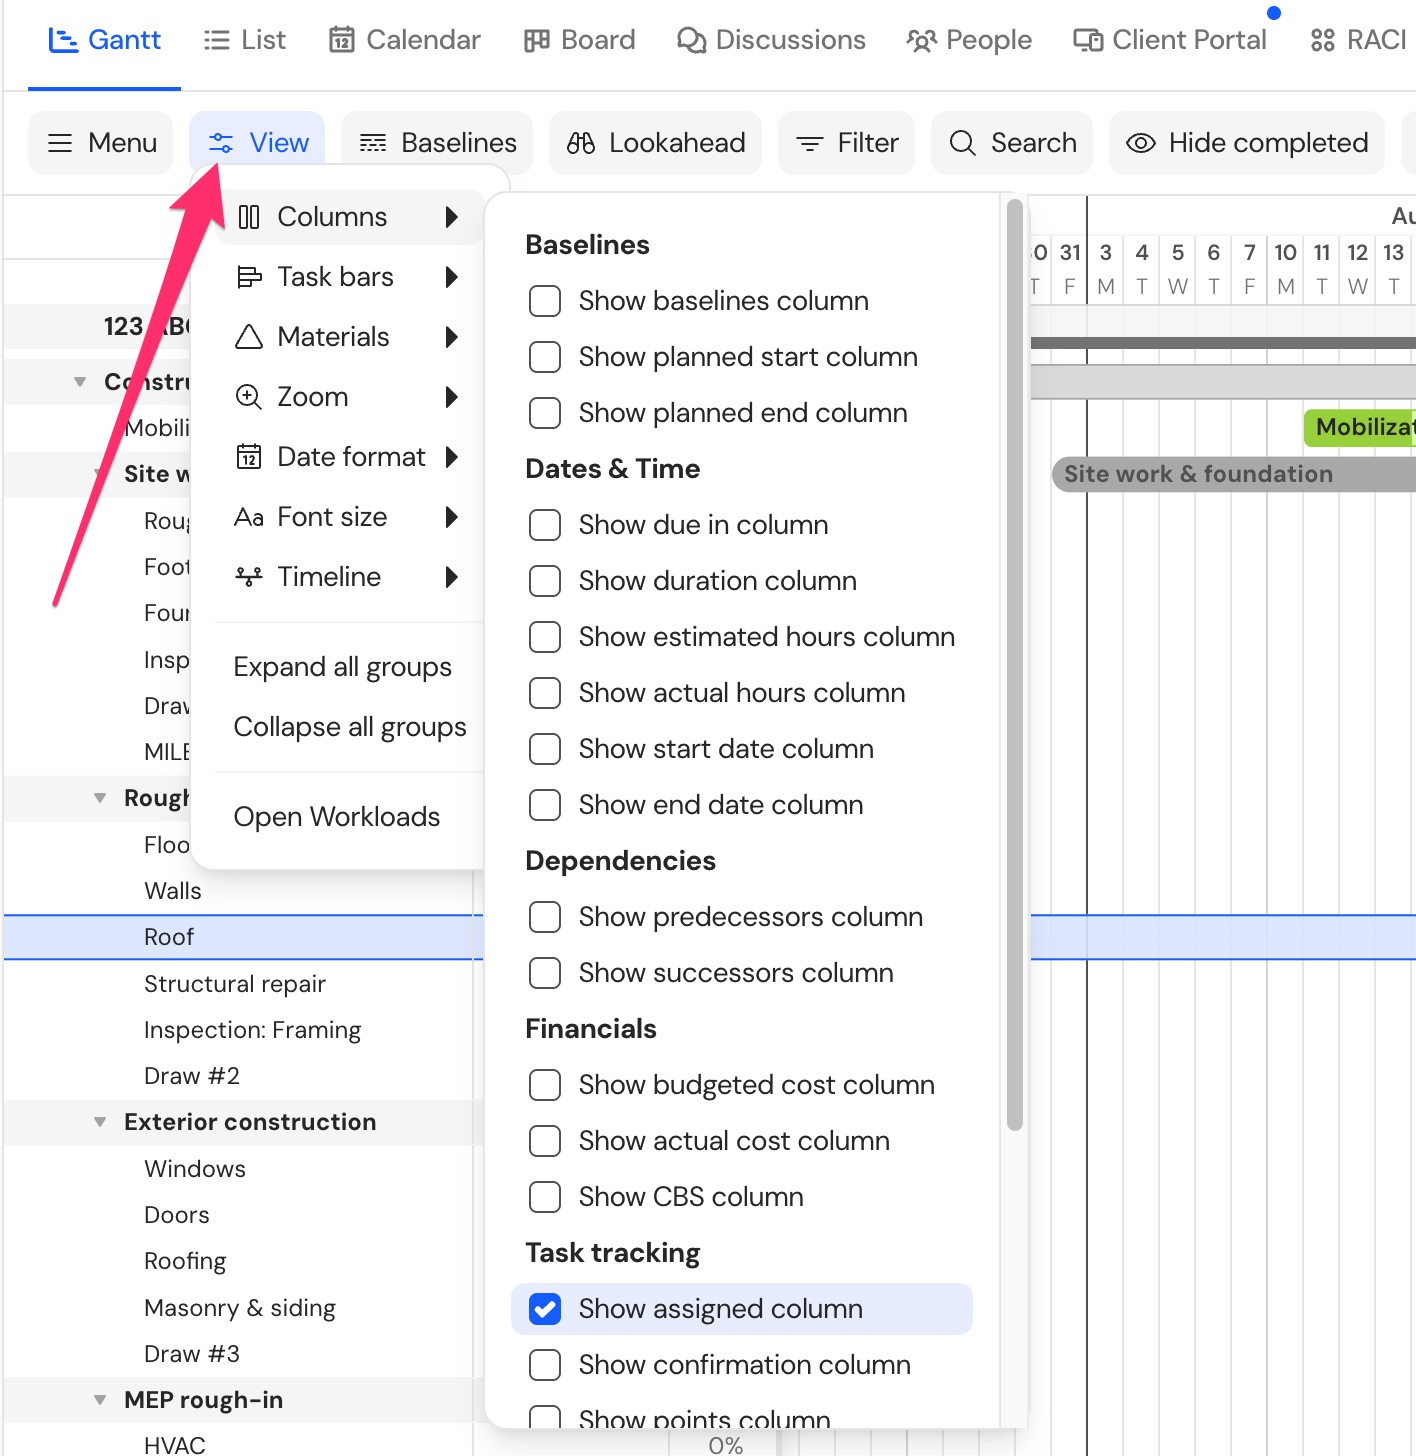
You can also open the
Columns menu by clicking on the header of any open column. 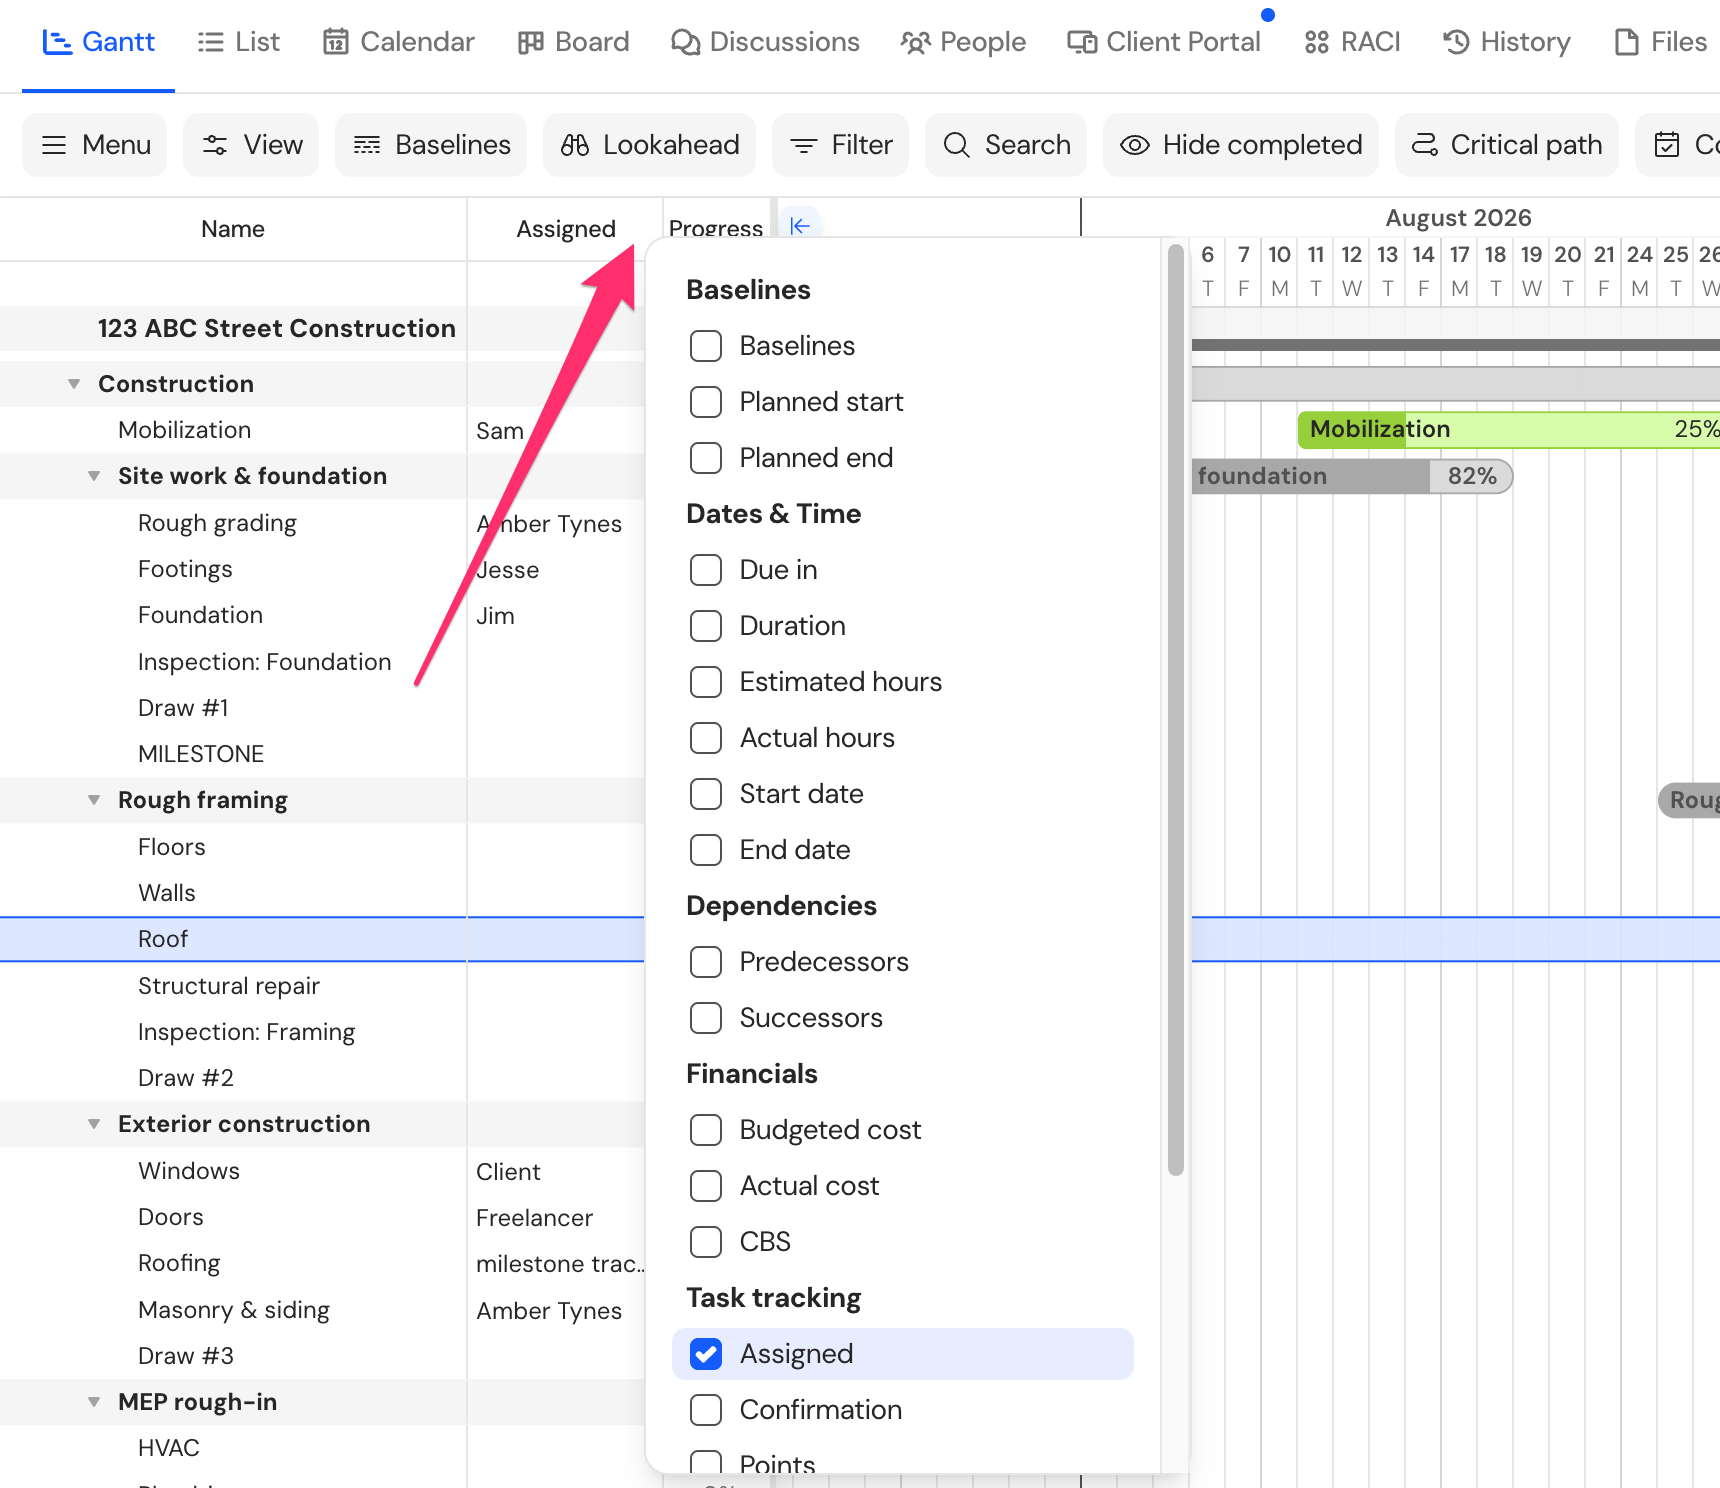
How do I hide all columns?
You can also easily hide all columns by clicking the
arrow icon on the right side of the columns. 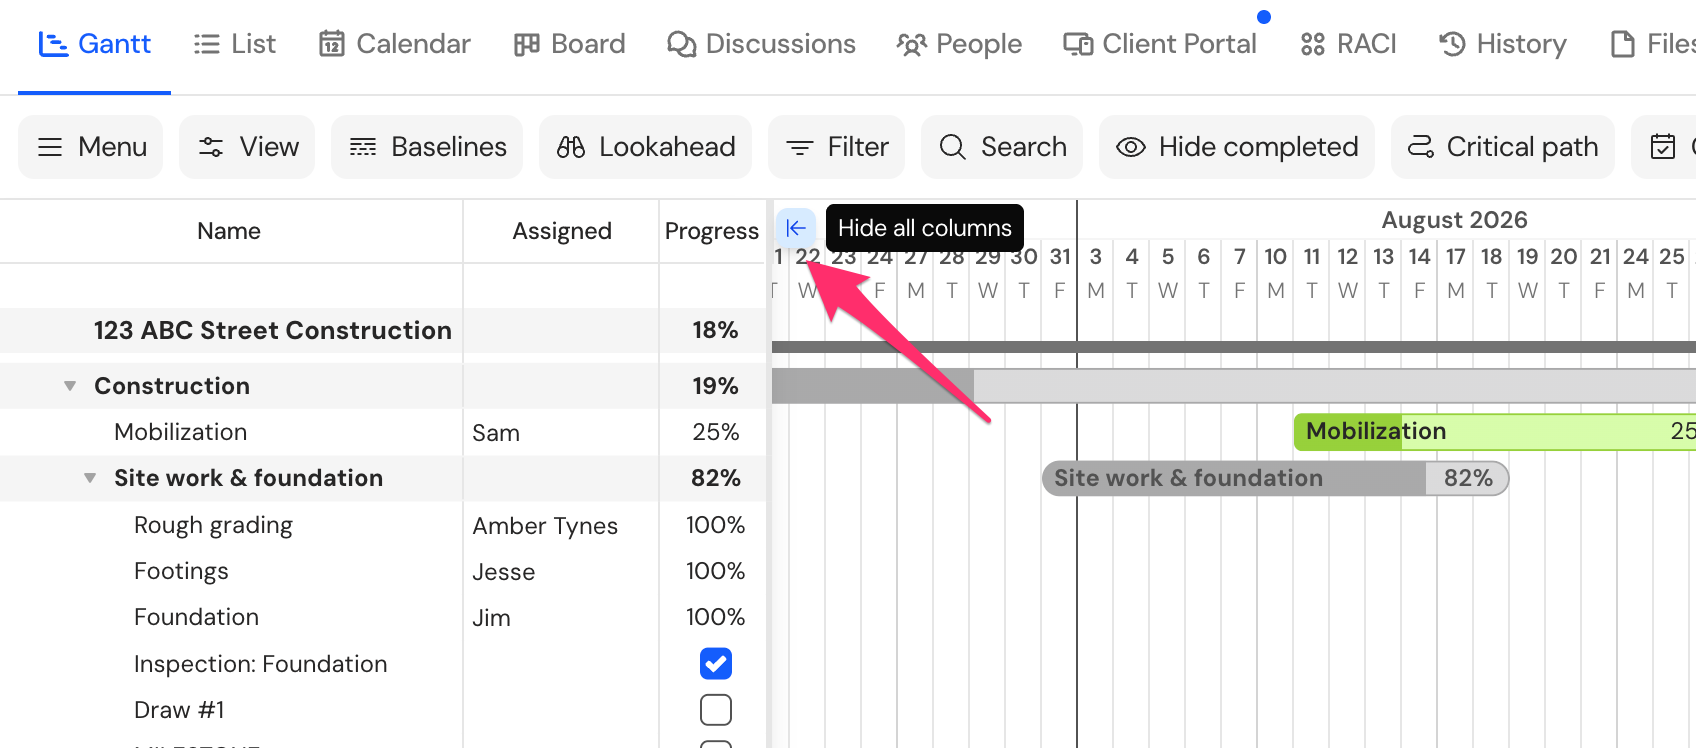
How do I bring columns back after hiding them?
Once all columns are hidden, you can easily bring the columns back by clicking the arrow icon on the left side of the Gantt chart. 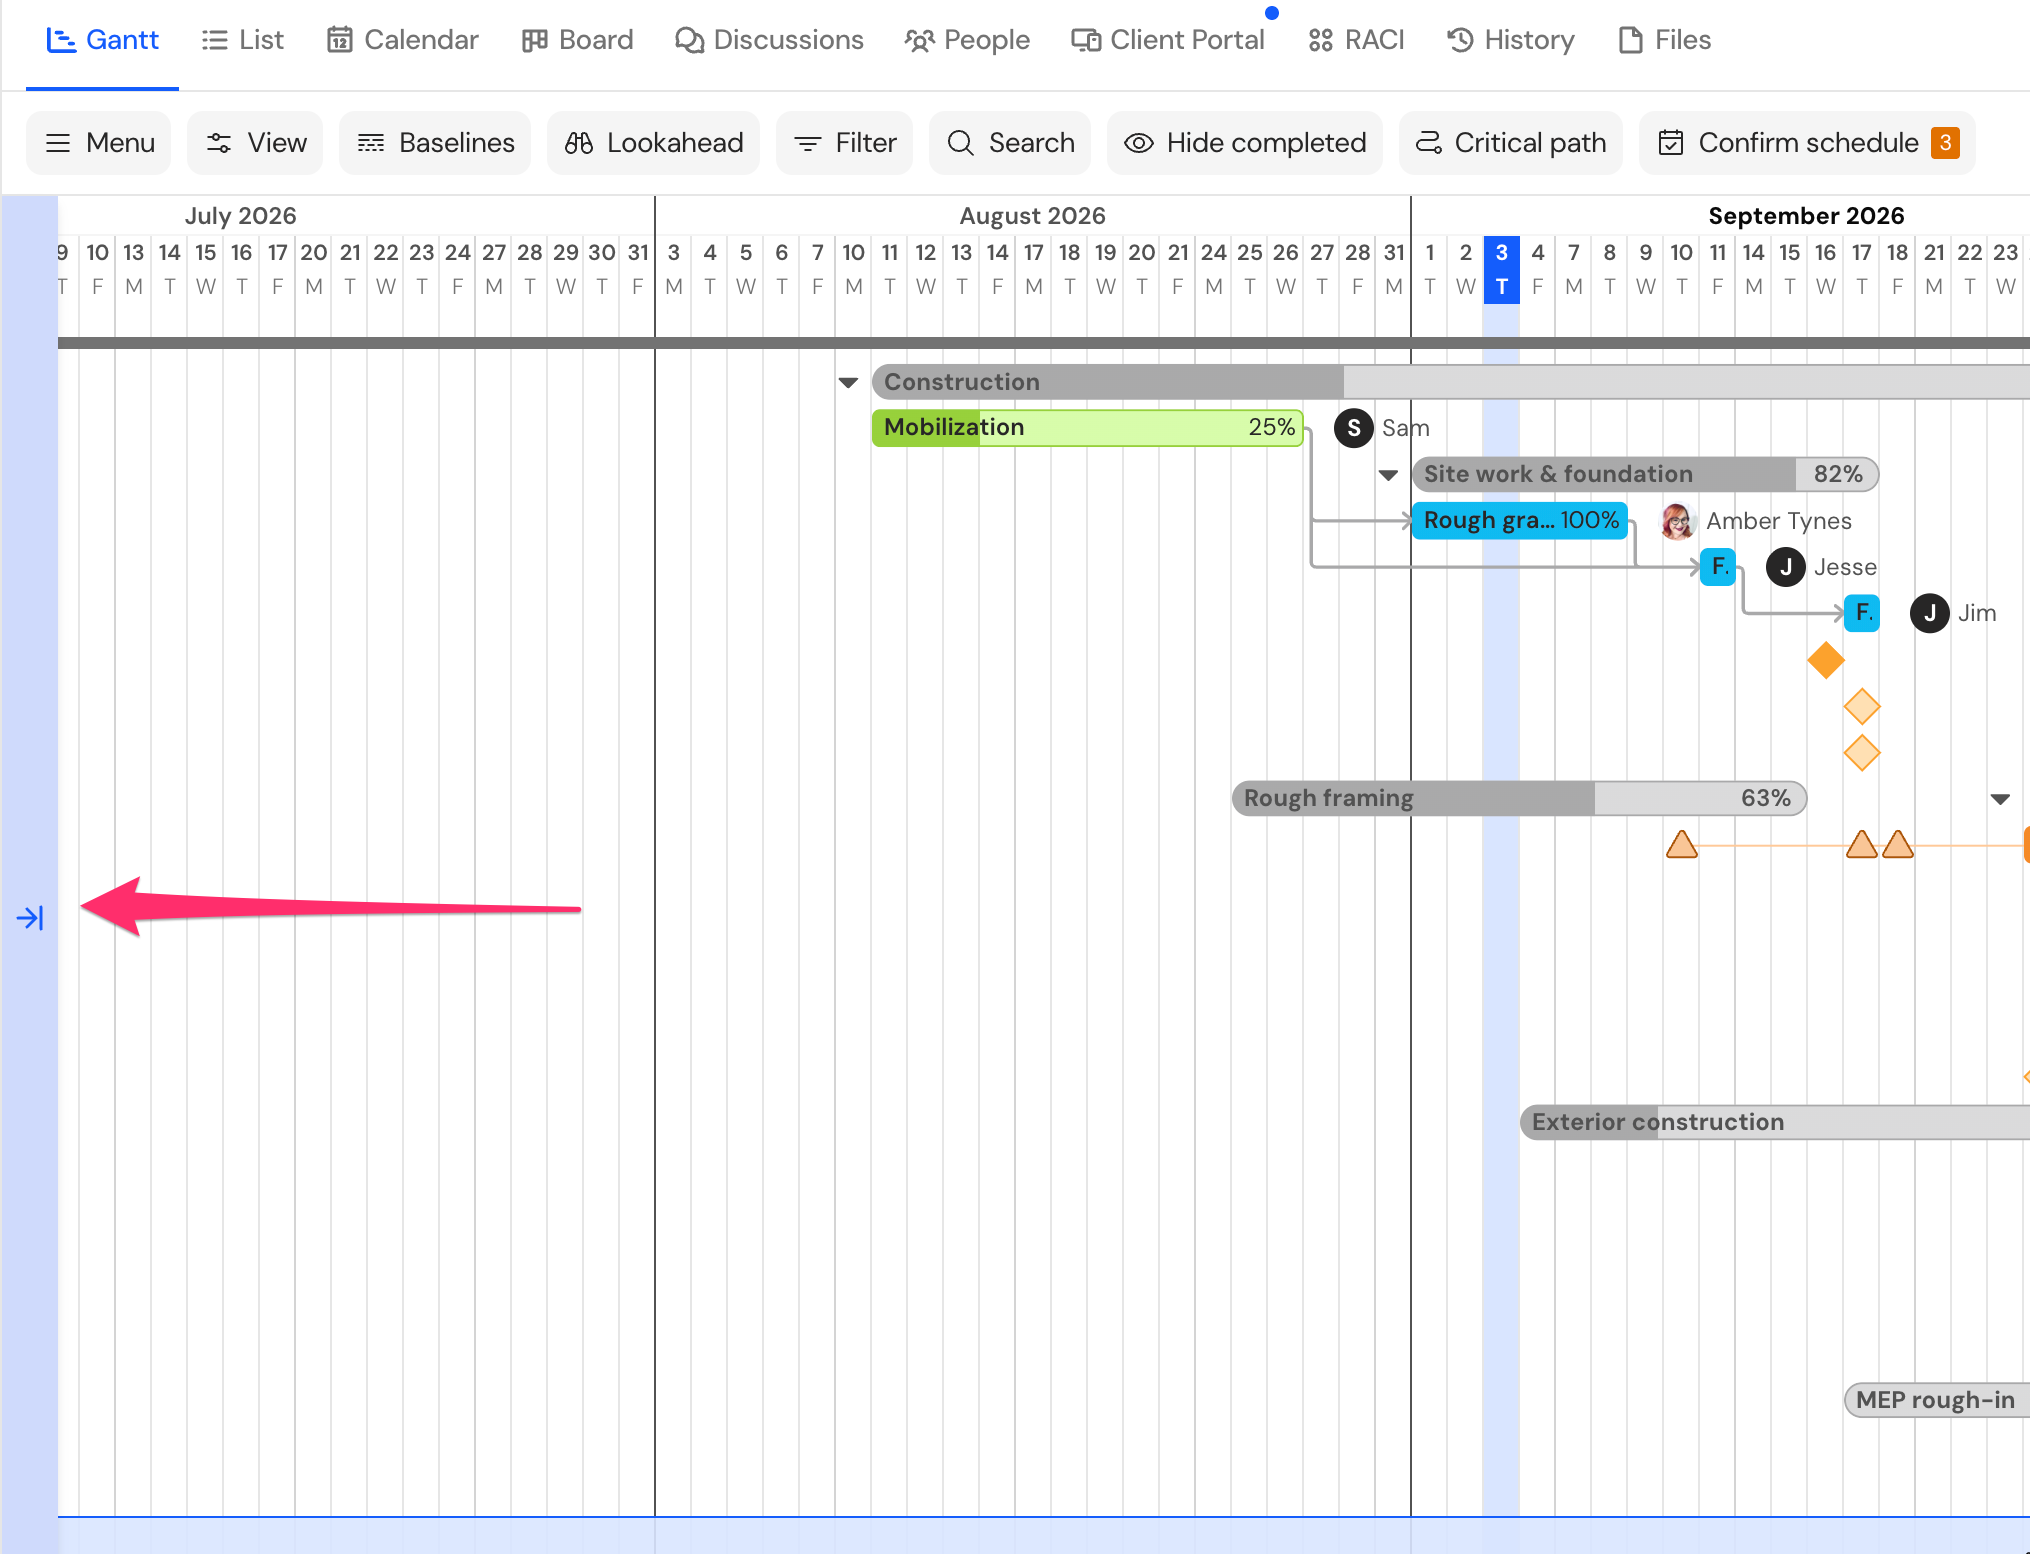
How do I reorder columns?
To reorder columns, click and drag the top of any column.
To note, the first 4 columns--Selection, Shortcuts, Color, and Name-- will always maintain their default positions.